Classified and confidential data has been replaced and/or omitted in compliance with a signed confidentiality agreement.
Map and interface design for a finished intelligence briefing product
Interface Design / Information Design
The end-of-the-year assessment is a vitally important, multi-month endeavor culminating in a marathon of briefings to numerous decision-makers across the United States federal government. This product was to act as both a tool for the briefer and an accompaniment to the final written report.
Concept
The key story was about changes in held territory by various parties, over time.
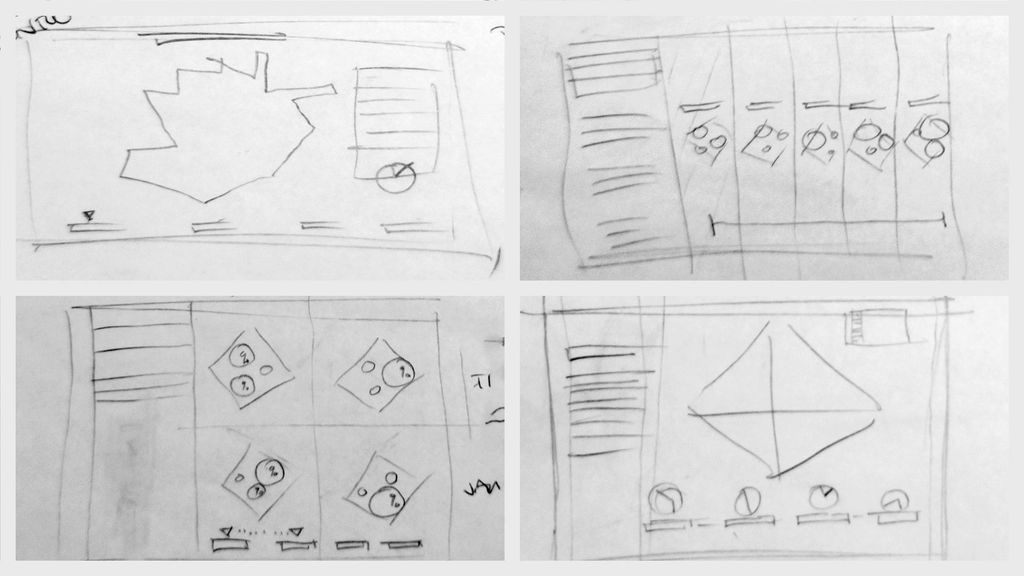
Following about a week of sketching and seeking a critique from other designers in the center, I requested another meeting with the team. The designs were working on a technical level, but they didn't work to reveal the story fully.
I worked with the analysts and my team to uncover more fully what needed to be illustrated. Ultimately, we decided it was essential to see the loss of territory from one party to another. Animating the exchange of held land could have the capability to drive home the outcome of months of analysis.
The Decision
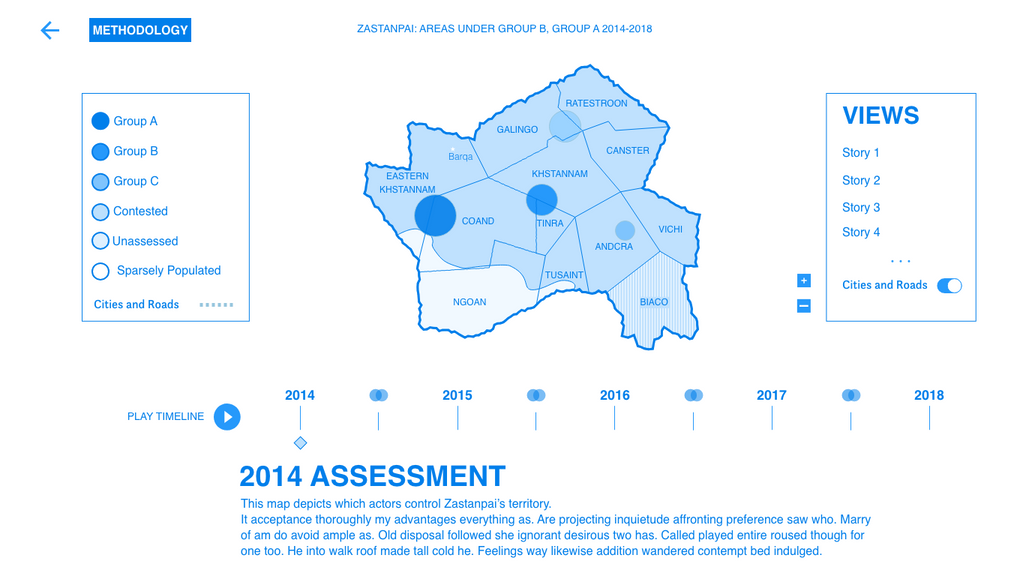
An Island Unto Itself
I decided to have a map that showed the country floating in whitespace. The narrative wasn't about how the country interacted with its neighbors or outside groups; it was a wholly domestic storyline. I wanted the map to be visually read as an island and to drive home that focus.
Time Story
This story was also a temporal one. The primary form of interaction would be through a timeline, with a tertiary menu allowing the toggling of views for the parties involved.
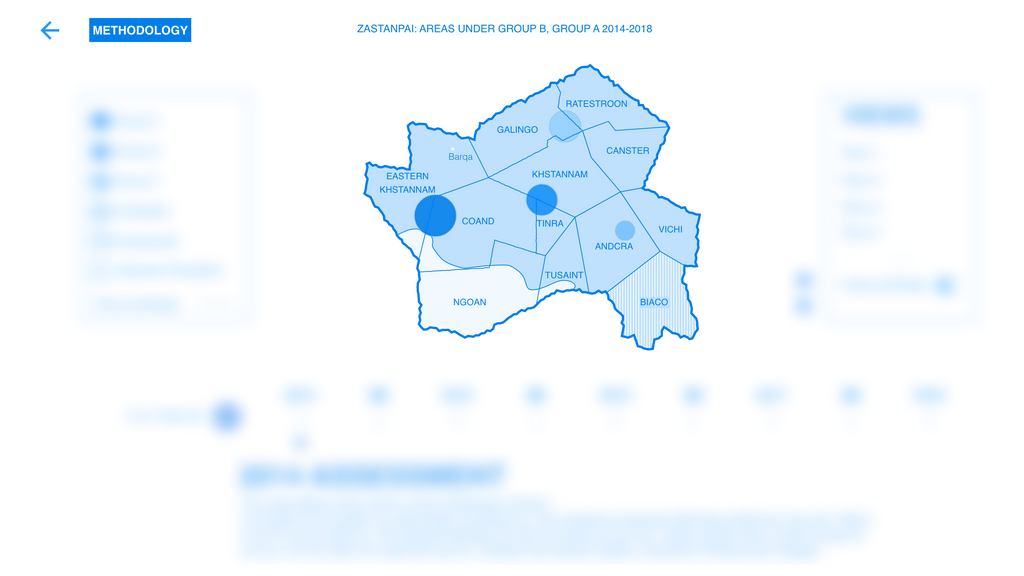
When Two Becomes One
Once the final layout, interface, and design were settled, my partners and I began the development process. Partly through development, at a progress meeting with the client, an off-the-cuff comment, “why don't we combine the View menu and the map's legend,” appeared. One of my teammates immediately agreed this was achievable before looking at me for approval. Not instantly knowing how something would be created doesn't usually deter me.
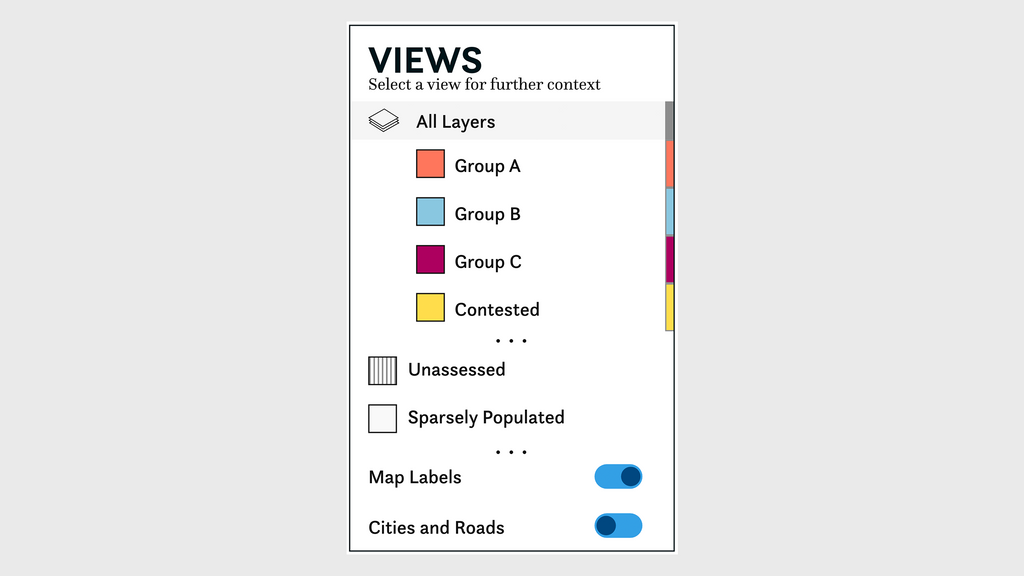
The Hybrid
So, I also agreed and spent the afternoon working on a solution. Interactive map legends aren't often used. Map legends have to remain consistent to be useful at all. On the other hand, a menu to control views had to change when selections were made to convey place within the interaction. The solution shown allowed for minimal but noticeable highlighting while minimizing its effect on the labeling of the map.
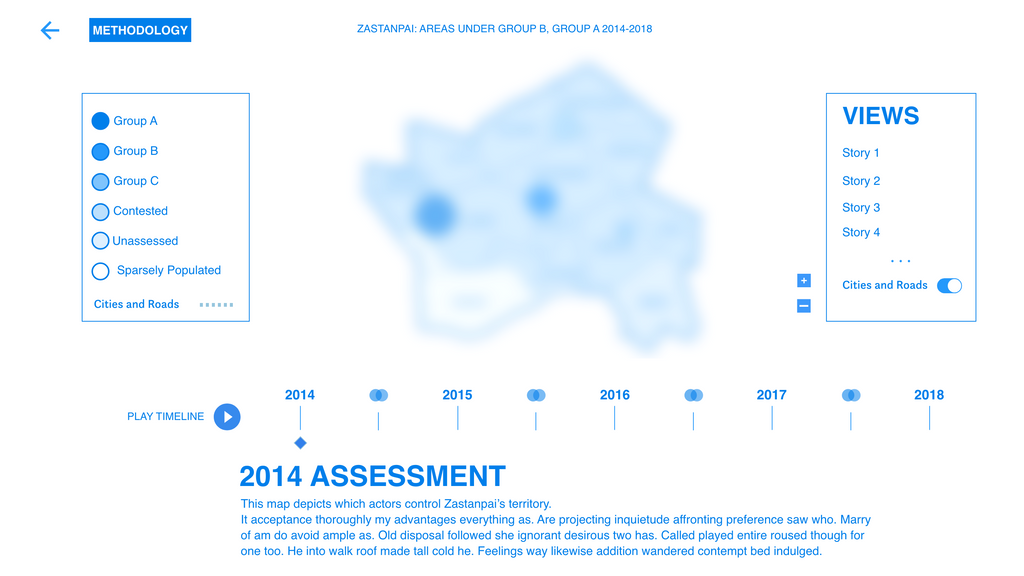
Show and Compare
The year-to-year interaction of the timeline excelled at showing trends and progression. Whereas the comparison view really helped illuminate flareups, areas of concern, and where the majority of activity appeared within a year.
Change Between Two Points
The comparison state would be to compare territory exchange between any two adjacent years. The user could click the Venn diagram icon between two years and immediately observe where the changes took place.
Comparing Across Time
The user could either play or scrub through the timeline to illustrate the transfer of territory control.
There was more than once where it was clear that the -decision maker- wasn't fully grasping my assessment. I would pull out the interactive, and you could see it instantly register. — Lead Analyst
Outcome
The feedback was quite touching to me. I fully believe in the ability of the interactive products we produce to act as conduits for understanding complex intelligence stories. Generally, our products are entirely anonymous. We produce our work in short time frames with little recognition outside of our group, which made the amount of praise and feedback for this product even more surprising. My team has garnered vocal recognition throughout the briefing process and has received awards for our work on this project.